April 30, 2021
What our sewerage says about Australia’s drug habits

National consumption of methamphetamine is down. Heroin consumption is up.
These are two findings from the latest National Wastewater Drug Monitoring Program (NWDMP) report.1
The report provides details from wastewater samples taken from 56 treatment plants across Australia over seven days in August 2020. Additional samples were also taken from capital cities in October 2020. These sampled areas cover 56% of the population.1
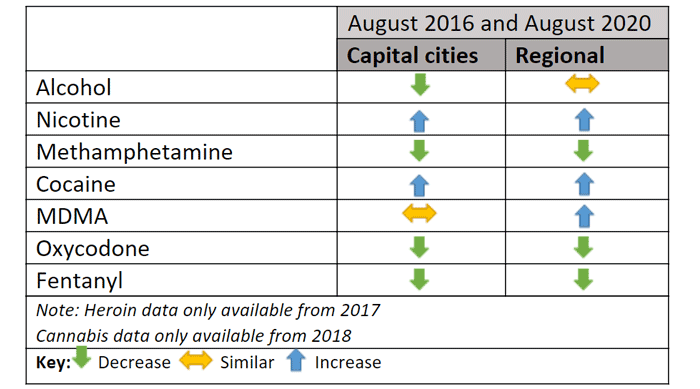
Now in its fourth year, the wastewater monitoring program provides government, police and health agencies with information about patterns, spikes and trends in drug use nationally, in specific locations, and over time. The table below shows the changes in drug consumption between 2016-2020.
Changes in average consumption of drugs monitored by the National Wastewater Drug Monitoring Program between 2016 and 2020. Source: 1NWDMP Report 2021 .

What the 2020 data tells us about Australia’s drug use
While nationally the consumption of methamphetamine (ice) decreased to a four-year low, it continues to be the most consumed illicit drug in Australia – more than 11,000 kilograms per year with an estimated street value of $7 billion.
At the same time, cocaine, MDMA and heroin increased to record high levels.
Alcohol and nicotine are consistently the most consumed legal drugs, significantly higher in regional areas.
Cannabis was first included in the program in 2018 and consumption rates have steadily increased since then, particularly in the Australia Capital Territory and regional parts of the Northern Territory, Queensland and South Australia.
Drug consumption trends by location in 2020
The latest report shows drug consumption was generally higher in regional areas, with the exception of heroin and cocaine.
Alcohol, nicotine, cocaine and cannabis use increased in both regional areas and capital cities, and capital cities also saw an increase in MDMA and heroin use.
Prescription painkillers, such as fentanyl and oxycodone, although legal, are also used recreationally and are included in the sample testing.
In 2020 there was a significant increase in oxycodone use in regional areas, particularly in Victoria and Queensland, compared to capital cities. Fentanyl use was also more likely in regional areas.
Drug use during COVID-19
Samples for the latest report were collected during the COVID-19 pandemic.
COVID restrictions – national and interstate border closures, bans on social gatherings, working from home – undoubtedly had an impact on drug supply and demand and may account for 2020’s drug consumption changes/patterns.
In addition to the record highs and lows mentioned, in one capital city the average oxycodone consumption exceeded that of methamphetamines – the first time this has occurred anywhere in the country since the testing program began.
Heroin consumption also changed. Since the onset of COVID the data shows a significant increase in heroin use in regional and metropolitan areas.
No significant changes in drug consumption were reported in Victoria despite the extended lockdowns and restrictions there.
What the NWDMP data doesn’t tell us
The information in the NWDMP report always generates media attention, with media outlets often grabbing select report highlights to create sensationalist headlines. However, it is important to take the report’s findings in context, understanding its limitations.
Samples collected for the wastewater monitoring program are taken from multiple sites within each state and territory, which is important to remember when looking at the state/territory-based results.
The results can be confusing. For example, alcohol use in the Northern Territory, Tasmania and Western Australia reached a record high in 2020; however, parts of WA and South Australia were also shown to have the lowest alcohol consumption rates in the country.
Methamphetamine rates too have shown large differences both between and within states and territories.
The lack of demographic data makes it difficult to know who are leading these trends – young or older people, wealthy, educated, etc. – and how their drug use may be changing over time.
It is also hard to know whether there are a lot of people using a small amount of a certain drug or a few people using a lot.
The important thing to remember about the NWDMP report is that it provides an insight into one aspect of the nation’s drug consumption. However, it’s only when it is combined with other data that we can get a clearer overall picture of drug use in Australia.
The next NWDMP report is due to be released in August 2021. If you would like to find out more about the program’s 12th report, it can be found here.
1. Australian Criminal Intelligence Commission. National Wastewater Drug Monitoring Program - Report 12 2021